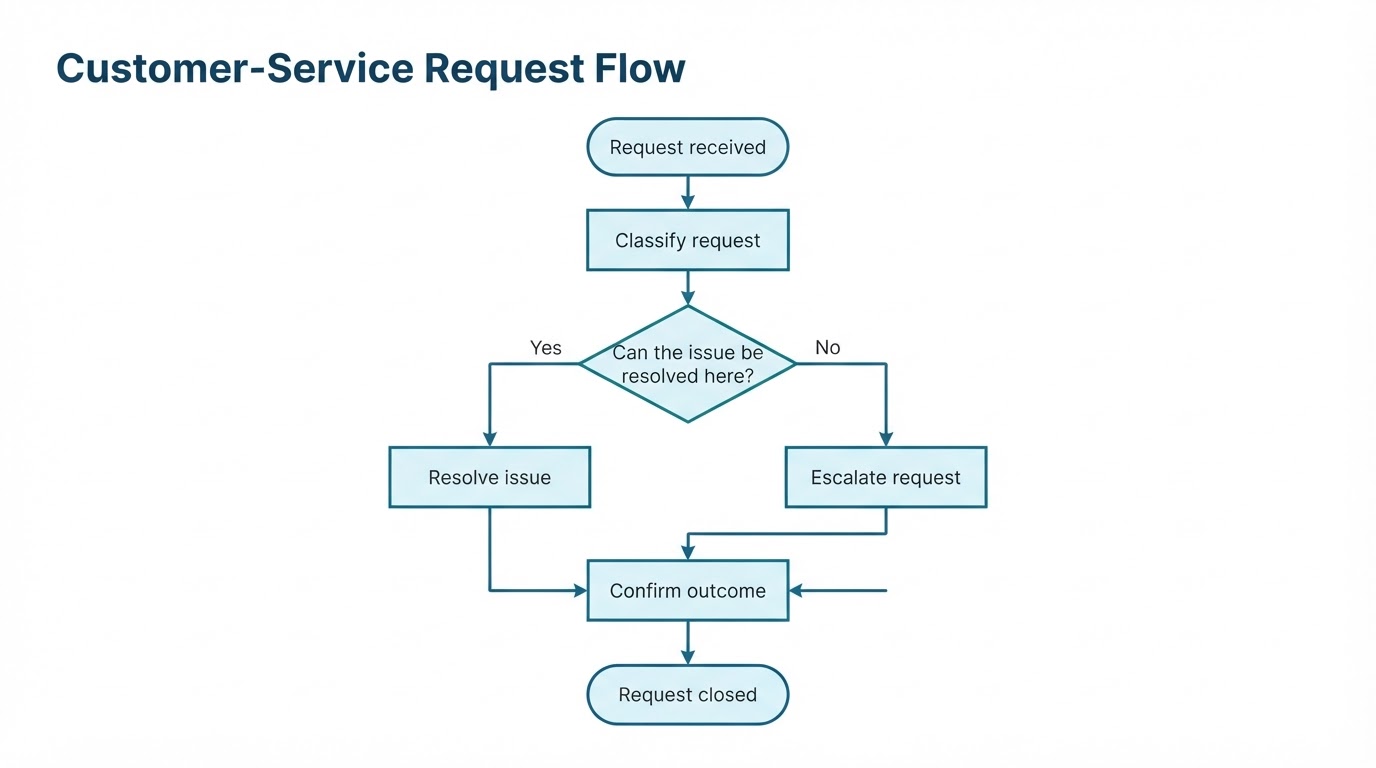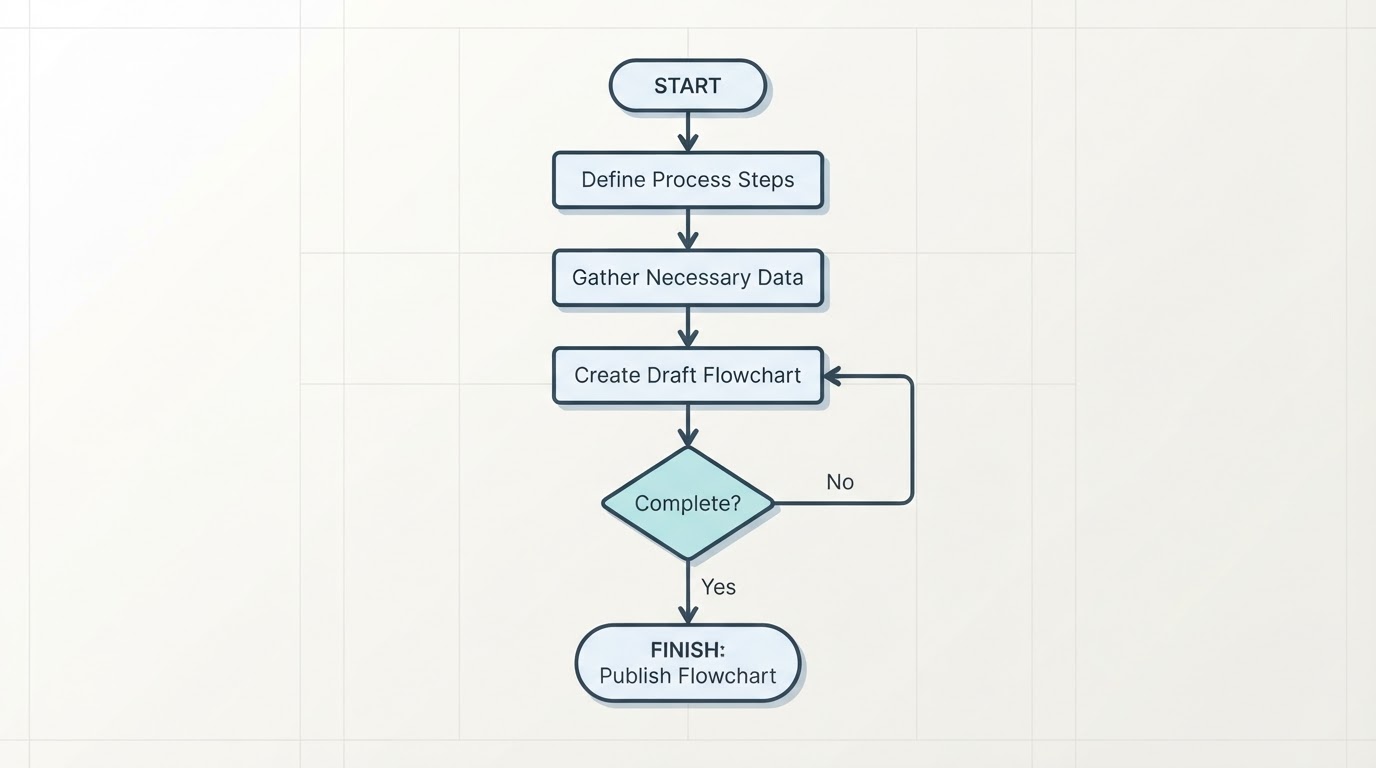
A flowchart turns a process, decision, workflow, or algorithm into a visual sequence of connected steps. Shapes, labels, and flowlines show actions, decisions, inputs, outputs, responsibilities, and possible outcomes more clearly than a long paragraph.
Flowcharts are useful for documenting business processes, planning software logic, troubleshooting problems, mapping customer journeys, explaining procedures, and identifying delays or unclear responsibilities. They do not prove that a process is efficient, correct, compliant, or secure; they represent the logic and information supplied by the person creating them.
The most reliable way to create a flowchart is to define its purpose and scope, list the process in plain language, choose consistent symbols, connect and label every path, test the logic, and then improve the layout. The method works on paper, in office software, in a browser-based editor, or in a specialized diagramming tool. This guide focuses on the planning and design principles that apply across those environments.
What Is a Flowchart and When Should You Use One?
A flowchart is a visual representation of a process, workflow, system, or algorithm. It uses symbols, text, and connecting lines or arrows to show the order of activities, decisions, inputs, outputs, and outcomes.
A simple flowchart may show one sequence from beginning to end. A more detailed diagram can include branches, loops, exceptions, handoffs, and multiple outcomes. The most useful flowcharts have a defined purpose instead of attempting to document every detail of a complex operation.
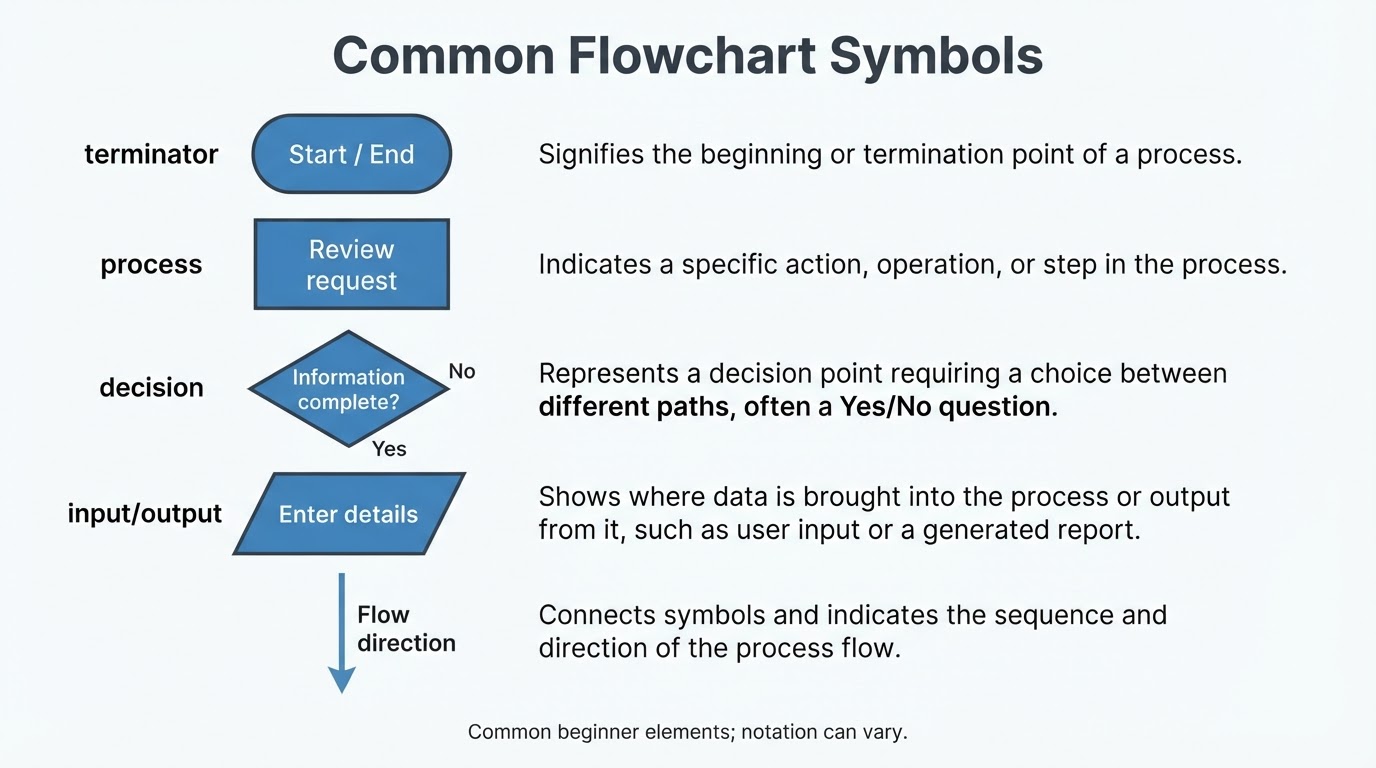
Flowchart Symbols and Meanings
Flowchart notation varies by diagram type, organization, and software. The following beginner-oriented set covers elements used frequently in basic process diagrams; it is not a complete or universal symbol standard. If you use less familiar notation, add a legend.
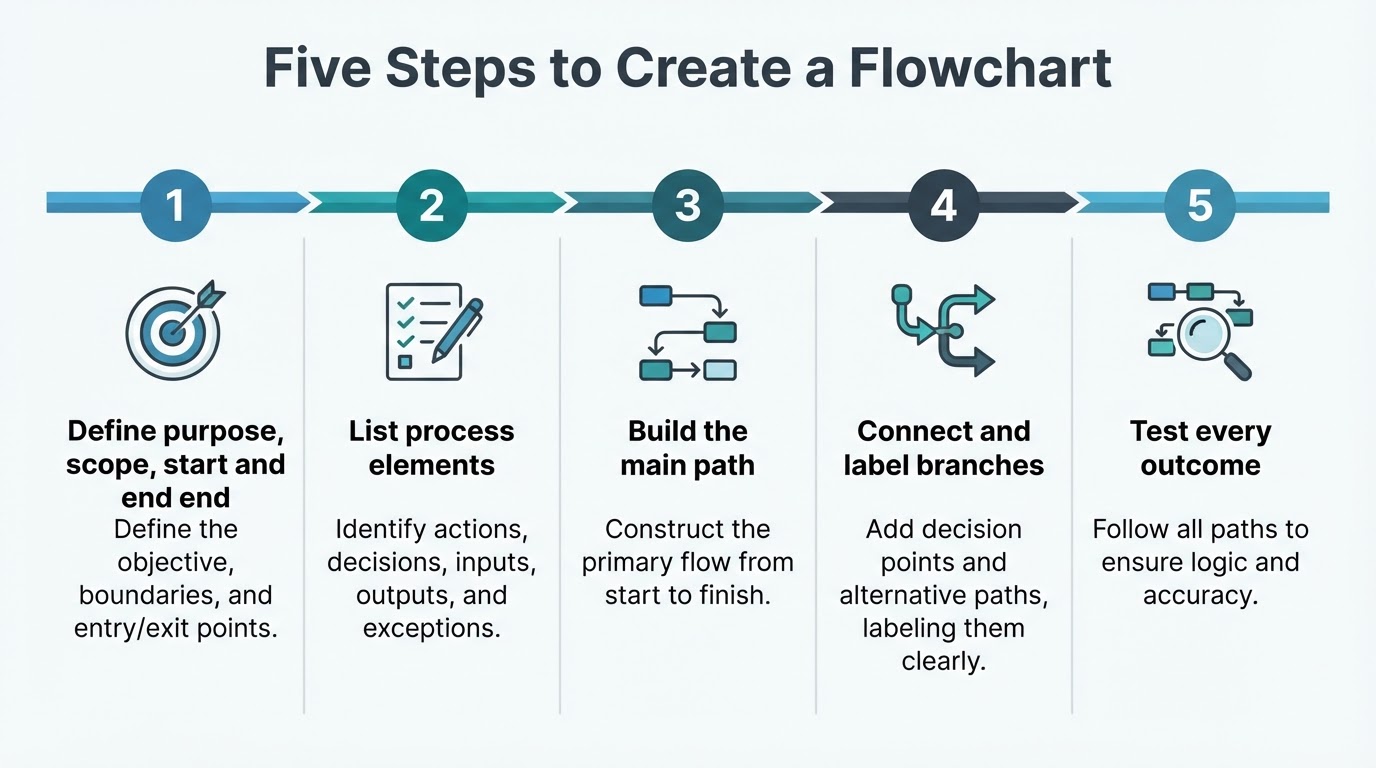
How to Create a Flowchart Step by Step
This is a tool-agnostic workflow. In a drawing or diagram editor, the practical translation is simple: create or insert the required shapes, type the labels, connect the shapes with flowlines, arrange them in a consistent direction, and review the result before sharing it.
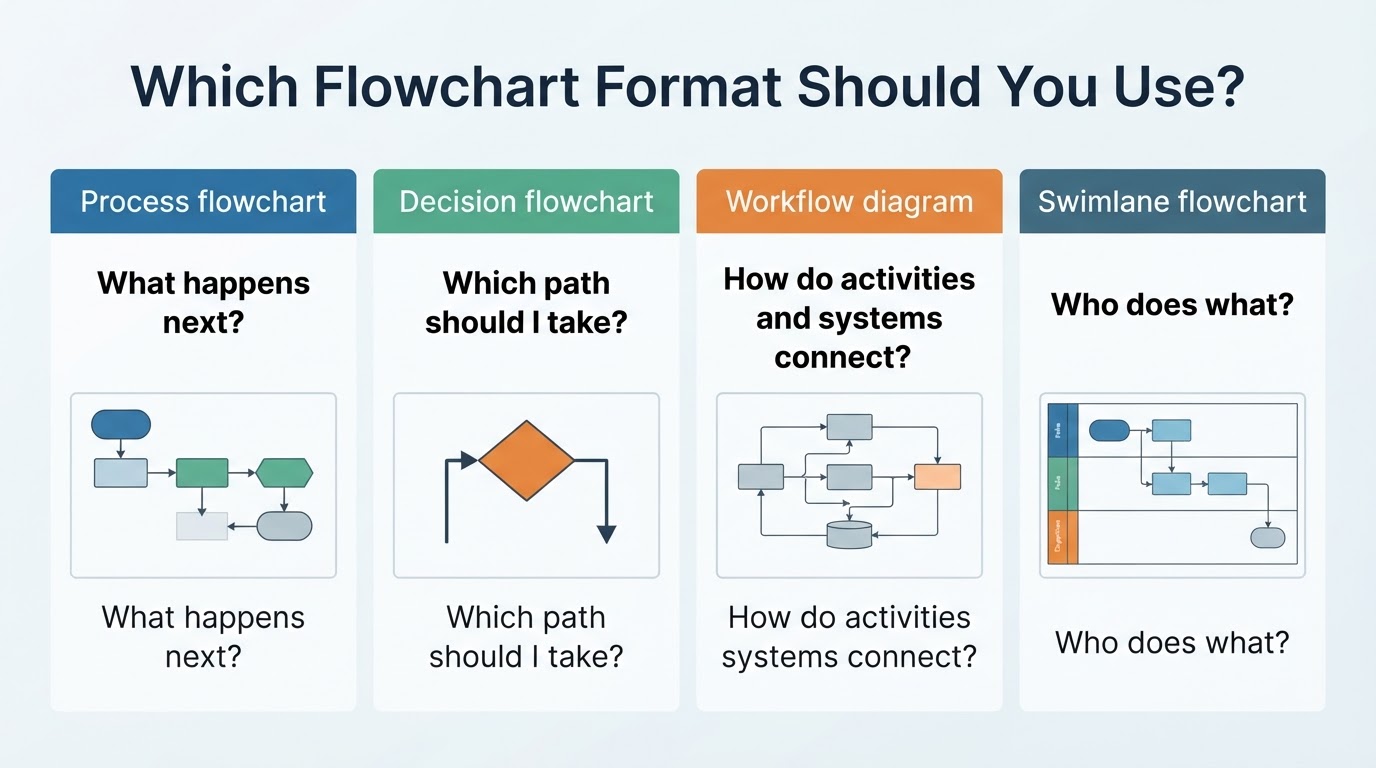
Flowchart Examples
The examples below show how to translate plain-language logic into a completed, platform-neutral flow. The labels are intentionally short so they can fit inside typical diagram shapes.
Make a Flowchart Readable and Accessible
A logically correct flowchart can still be difficult to use if it is crowded or inconsistent. Align shapes, use predictable spacing and typography, keep labels concise, and reduce line crossings. Make the primary route easy to find.
Do not rely on color alone to communicate status, decisions, or outcomes. Use text labels, distinct shapes, or other cues as well. For digital diagrams, these are minimum visual practices rather than a guarantee of accessibility. Accessibility also depends on the publishing format and platform.
Common Flowchart Mistakes
Most flowchart problems come from unclear planning rather than the drawing software. Use these corrections:
- Drawing before defining scope: Identify the purpose, start, end, and audience first.
- Using a process shape for a question: Use a decision diamond when a condition creates different paths.
- Leaving branches unlabeled: Name every outgoing condition and show where each path leads.
- Mixing reading directions: Choose top-to-bottom or left-to-right and use it consistently.
- Crowding shapes with long text: Shorten labels and move supporting detail outside the diagram.
- Creating excessive line crossings: Rearrange shapes, use connectors carefully, or split the process.
- Including every minor detail: Separate a high-level flow from detailed sub-processes.
- Relying on color or icons alone: Make the logic clear through labels, shapes, and connectors.
- Skipping independent review: Ask someone unfamiliar with the process to follow every path.
Fix the logic before polishing the visual design. A neat diagram with missing branches is still an unreliable explanation.
Choose How to Draw, Share, and Maintain Your Flowchart
Choose a creation method according to the diagram's complexity, collaboration needs, audience, export requirements, and information sensitivity.
- Paper or a whiteboard: Useful for brainstorming and early logic planning.
- Office or document software: May suit simple diagrams that need to appear in an existing document or presentation.
- Browser-based editor: May help with collaboration and remote access. Review the provider's account, storage, sharing, and data-handling terms before uploading sensitive information.
- Specialized diagramming platform: May suit projects that need richer symbol libraries, structured layouts, collaboration, or export options. Confirm the selected tool's actual capabilities.
For local creation, avoiding a third-party upload may reduce one type of exposure, but local files are not automatically private or secure. They may be synchronized, backed up, shared, accessed by other users, or processed by connected software. Review device security, permissions, backups, and synchronization settings.
Maintain the flowchart when the underlying process changes. Recording an owner, revision date, or version identifier can help readers judge whether the diagram is current.
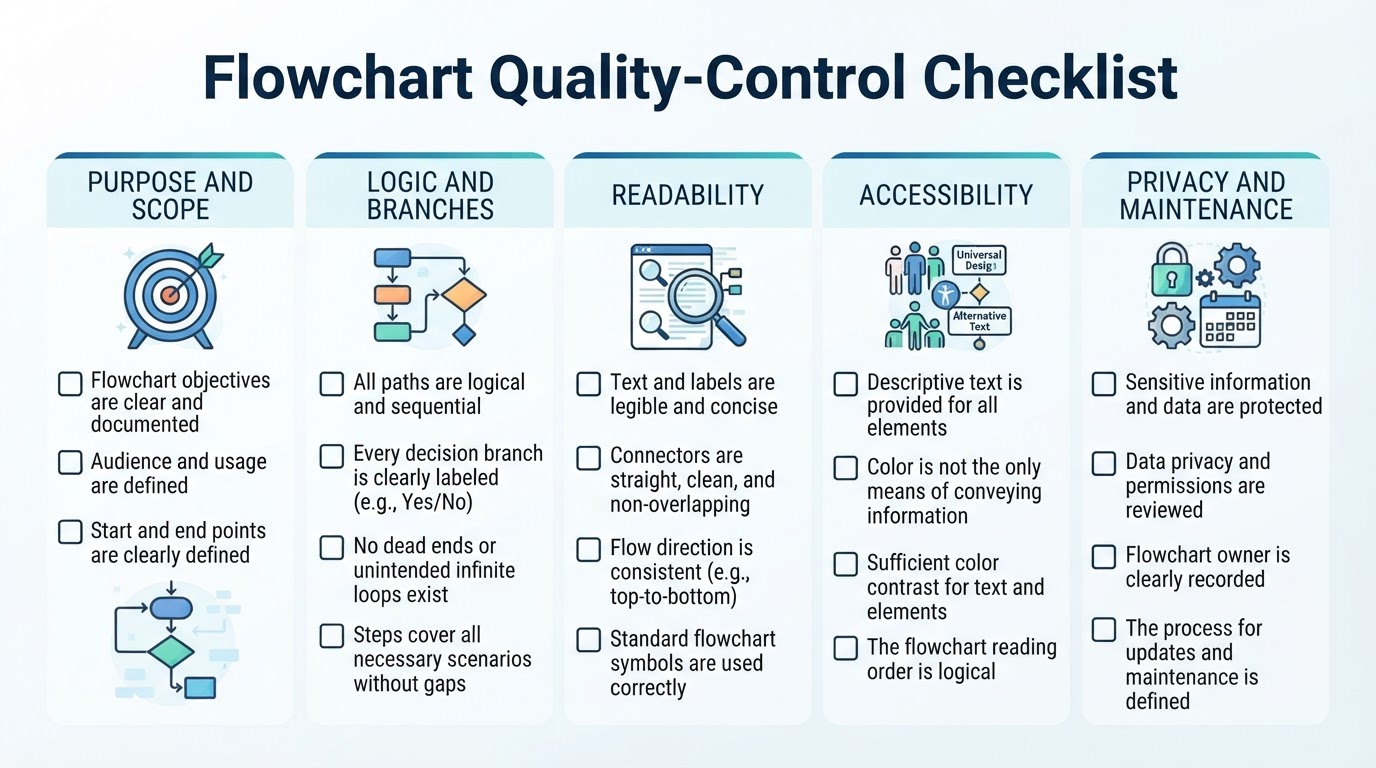
Flowchart Quality-Control Checklist
Before publishing, presenting, or implementing a flowchart, check:
- Purpose: Is it clear what the diagram explains or helps decide?
- Scope: Are the start and end conditions defined?
- Logic: Does every action, decision, input, output, loop, and exception have a clear place?
- Symbols: Are elements used consistently, with a legend for unusual notation?
- Direction: Can readers follow the flowlines without guessing?
- Branches: Are all decision paths labeled and connected to meaningful outcomes?
- Completeness: Are there dead ends, missing inputs, ambiguous conditions, or unintended loops?
- Readability: Are spacing, alignment, text length, contrast, and line crossings under control?
- Accessibility: Is color-independent information available, and is a text description provided when needed? Has the actual export or publishing format been checked?
- Privacy: Have sensitive details and sharing permissions been reviewed?
- Maintenance: Is there an owner or update process when the underlying workflow changes?
A branch-by-branch walkthrough with someone who did not create the diagram is one of the most useful final checks.
Conclusion
An effective flowchart starts with clear scope and plain-language logic, not visual styling. Define the purpose, start, end, and audience; list the actions, decisions, inputs, outputs, exceptions, and loops; then choose consistent elements and connect every path.
Use one main reading direction, label branches explicitly, test every outcome, and split large processes into linked sub-diagrams when necessary. Before sharing the result, review readability, accessibility in the chosen format, sensitive information, permissions, and the plan for keeping the diagram current.